

Biomarkers Through A Circadian Lens
Biomarkers Through A Circadian Lens
What you were never taught about your bloodwork

I stand by the following statement:
“Circadian biology fundamentally controls every aspect of health.”
To give you one example of this, we’ll explore the biomarkers included in your average blood test. Each and every one of these biomarkers is built on the foundation of circadian biology.
The only evidence I need to prove this to you is to run you through a number of these biomarkers and their specific absorption spectra. In other words, I’m going to show you what nanometer of light they absorb, especially where they absorb strongest.
Let’s begin.
Hemoglobin (Hb)
Absorption Spectra: 400–700 nm
Key Peaks: 415 nm (Soret band), 540 nm, 575 nm (oxygenated and deoxygenated forms absorb differently)
Details: Used to assess oxygen levels in the blood (pulse oximetry)
Bilirubin
Absorption Spectra: 400–500 nm
Key Peaks: Around 450 nm
Details: Assesses liver function and hemolysis
Cholesterol (Total, LDL, HDL)
Absorption Spectra: 500–550 nm (Enzymatic methods using colorimetry)
Lipoproteins themselves do not have specific absorption peaks in the UV-visible spectrum because they are complex particles composed of lipids and proteins. The proteins within lipoproteins (e.g., apolipoproteins) may absorb light in the ultraviolet (UV) range, specifically around 280 nm, due to the presence of aromatic amino acids (tryptophan, tyrosine, and phenylalanine).
Glucose
Absorption Spectra: 505 nm (hexokinase method, enzymatic reaction)
Details: Spectrophotometric assays for glucose often use enzymes that result in color change detectable at specific wavelengths.
Triglycerides
Absorption Spectra: 500 nm (enzymatic methods with colorimetric detection)
Details: Triglyceride levels are usually measured through an enzymatic reaction that produces a color detectable at 500 nm.
Albumin
Absorption Spectra: 280 nm (for protein detection)
Details: UV absorption due to tryptophan and tyrosine residues in the protein.
Creatinine
Absorption Spectra: 500 nm (Jaffe reaction, colorimetric method)
Details: Used to assess kidney function.
Urea (BUN)
Absorption Spectra: 540 nm (colorimetric method with diacetyl monoxime)
Details: A measure of nitrogen in the blood, indicative of kidney function.
C-Reactive Protein (CRP)
Absorption Spectra: 340 nm (turbidimetry)
Details: Inflammation marker, measured through turbidimetric or immunological methods.
Iron
Absorption Spectra: 248.3 nm (atomic absorption spectroscopy)
Details: Measured using colorimetric or AAS methods to assess iron levels in the blood.
Ferritin
Absorption Spectra: 340–400 nm (enzyme-linked immunoassay)
Details: Measures iron storage in the body.
Transferrin
Absorption Spectra: 340 nm (measured via immunoassay)
Details: Assesses iron-binding capacity.
Vitamin D
Absorption Spectra: 265 nm (high-performance liquid chromatography, HPLC method)
Details: Specifically, Vitamin D and its metabolites absorb light in the UV range, mainly due to their steroid structure. Vitamin D2 (ergocalciferol) and Vitamin D3 (cholecalciferol) absorb light at wavelengths around 265 nm in the ultraviolet (UV) region.The active form of Vitamin D, 1,25-dihydroxyvitamin D, and other metabolites also show absorption in the 260–280 nm range.
Thyroid Hormones (T3, T4)
Absorption Spectra: 240–350 nm (often measured by immunoassays rather than direct absorption)
Details: Used for assessing thyroid function.
Insulin
Absorption Spectra: 280 nm (due to protein structure)
Details: Typically measured through immunoassays, but the protein absorbs in the UV range.
Lactate Dehydrogenase (LDH)
Absorption Spectra: 340 nm (enzyme reaction with NADH)
Details: Measured through enzymatic reactions involving NADH oxidation, typically used to detect tissue damage.
Alanine Aminotransferase (ALT) and Aspartate Aminotransferase (AST)
Absorption Spectra: 340 nm (based on NADH absorbance in enzymatic assays)
Details: Liver enzymes, measured using enzymatic reactions that change absorbance in the UV range.
Alkaline Phosphatase (ALP)
Absorption Spectra: 405 nm (colorimetric reaction)
Details: Enzyme levels are measured via colorimetry.
Gamma-glutamyl Transferase (GGT)
Absorption Spectra: 405 nm (colorimetric detection)
Details: An enzyme indicative of liver function.
Lactate
Absorption Spectra: 340 nm (enzymatic method)
Details: Uses NADH, where lactate concentration is measured through enzyme-coupled reactions.
SHBG (Sex Hormone-Binding Globulin)
Absorption Spectra: Typically measured via immunoassays rather than direct absorbance.
Details: Important for hormone levels, but no direct absorption spectrum used.
Calcium
Absorption Spectra: 422.7 nm (flame atomic absorption spectroscopy)
Details: Measures calcium levels directly through atomic absorption or colorimetric assays.
24. Magnesium
Absorption Spectra: 285.2 nm (atomic absorption spectroscopy)
Details: Measured using AAS or colorimetry.
25. Phosphorus (Phosphate)
Absorption Spectra: 340–400 nm (colorimetric method)
Details: Assesses phosphate levels using spectrophotometric assays.
This short list gives you an idea of what we’re dealing with here.
Every biomarker, even if it doesn’t specifically absorb light, is inextricably tied to light during its reaction and overall process.
Take note of the wide range of nanometers involved as well.
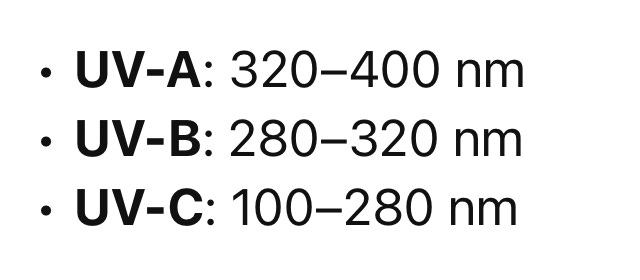
Anything within the 100-280 nm range is classified as UV-C light. In other words, we’re talking about biophoton emission linked to every cellular reaction in the body. This is the light we produce from within.
Anything within 280-320 is UV-B light from the sun.
Lastly, the 320-400 nm range is UV-A light from the sun as well.
The implications this has for your bloodwork and health status cannot be understated because it means your lifestyle around light and circadian biology makes all the difference in how these biomarkers function.
I have never come across somebody making this connection between the biomarkers and their absorption spectra. I hope you enjoyed it.
Much love,
Zaid